05.06.2026
Time to read:
9
min
Mobile app analytics
Guides
Try to remember what our lives looked like ten years ago. There were only a few apps, and most services lived in the browser: people used marketplaces through websites, and app-based delivery services were not particularly trusted — orders were more often placed directly on a restaurant’s website. Recommendation systems and algorithms were still taking shape, and personalization was almost nonexistent. Most everyday activities — from making payments to completing paperwork — happened offline. Even if a company had an app, it usually served as an “add-on” rather than a core product, and businesses did not view mobile as the primary channel for working with customers.
Since then, the world has changed. Mobile services have not just become mainstream — they have become far more sophisticated and technologically advanced. Interfaces are polished down to the smallest detail, algorithms adapt to us, and services are becoming “smart,” quietly taking over dozens of tasks. In 2024, the mobile app market grew to $540 billion, and by 2026, it is projected to reach $585 billion. People are spending more and more time in mobile services, which means competition for attention and convenience is only increasing.
Have you ever wondered how top apps reached their current level of performance and efficiency? How did they become so seamless and precise? How is it that people come back to them every day, spend time there, place orders, and subscribe to services? Can this kind of user experience really be built blindly — based only on intuition or inspiration? Of course not.
Behind every seamless screen is mobile app analytics. It goes far beyond counting downloads and showing basic metrics. It tracks what happens inside the product: where users get stuck, when they close the app, and at what step questions or friction arise. And, on the other hand, it shows what captures attention, what drives engagement, and when users begin to take action. Without this, it is impossible to truly understand how a product works or where it should evolve next.


What Mobile Analytics Is — in Simple Terms
In-app analytics is the process of collecting and analyzing user actions. Who came to your mobile service, what they tapped, how much time they spent on a screen, what they bought, and where they simply closed the app. All of this data comes together to form a clear picture of how people use the product, where they run into difficulties, what works, and what doesn’t. This makes it possible to evaluate the effectiveness of the user experience and understand which direction to move in next.
To do this, an analyst sets up specialized tools that track key events, actions, and indicators inside the app. The data is then analyzed so decisions are made based on facts rather than guesswork. This approach helps improve the interface, increase engagement, retention, and conversion — and ultimately make the product better for the user.
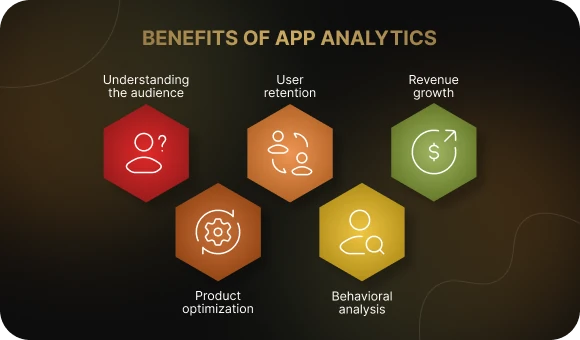
What Analytics Helps You Do in a Mobile App
Understand your audience.
Who your users are, what devices they use, which traffic sources they come from, and how often they open the app. This is an important first step in speaking their language.
Study user behavior.
What actions people take in the app: what they search for, which screens they spend the most time on, and where they most often exit. Analysts use this data to identify bottlenecks and growth opportunities.
Optimize the product.
Which features are in demand and which go unnoticed. Where users run into friction or don’t understand what to do next. This makes it possible to improve both the interface and the service logic.
Retain users.
Mobile analytics shows why people stop using the app, when it happens, and what can be done to bring them back. For example, by changing onboarding, sending a push notification, or redesigning a flow.
Increase monetization.
How many people make purchases, how much they pay, and how they convert from a free version to a paid one. These metrics help improve in-app sales performance.
Evaluate marketing.
How effective your advertising channels are: which ones actually bring in active users and which ones simply consume budget. Analytics tools make it possible to connect an install with later user behavior.
How to Implement Analytics in a Mobile App: Step by Step
Before talking about tools and metrics, it’s important to understand the logic itself. How does mobile analytics implementation actually work? For clarity, let’s look at an example: a food delivery app. It will show why all of this matters and how it works in practice.
Step 1. Define goals and KPIs
Before connecting tools and collecting data, you need to understand why you’re implementing analytics. What goals matter most for the product right now? What counts as success? It could be increasing order conversion, reducing time to payment, bringing back users who haven’t opened the app in a while, or improving day-7 retention after installation. These goals determine which data you’ll track and how your analytics setup should be built.
Example:
The delivery app team notices that users often fail to reach the final checkout screen. The goal is to increase order conversion by 10%. To achieve this, the analyst defines the key metrics: funnel depth, average time spent at each step, and the number of abandoned carts. These indicators help reveal exactly where users are dropping off.
Step 2. Choose your tools
Next comes platform selection. Everything depends on your goals, budget, and team resources. You can use a single service or build a stack — for example, Firebase for core analytics, AppMetrica for ad tracking, and Amplitude for behavioral analysis.
Example:
The team chooses Google Analytics for Firebase as the foundation — it’s free, quick to implement, and provides basic metrics and event tracking. They also add AppMetrica to see which advertising channels bring in customers and how those users behave afterward. This helps evaluate traffic quality and track the user journey from the very beginning.

Step 3. Set up tracking
The tools need to be implemented correctly. This usually means installing an SDK and setting up events — touchpoints that record actions inside the app: opening a screen, selecting a meal, adding it to the cart, tapping the “Pay” button, canceling an order. These events become the foundation for analysis. At this stage, the analyst works together with the development team: events are added to the code, the necessary parameters are defined, and data transmission is tested.
Example:
Developers add events for every step of the checkout process. The analyst sees that users spend the most time on the payment method step, and some drop off there. The data shows that this is exactly where time and conversion are being lost — a clear sign that the UX of this screen needs improvement.
Step 4. Analyze the data and form hypotheses
Once events start being collected, the most important part begins: analysis. The analyst studies funnels, looks at user behavior, finds bottlenecks, and segments users. This is where hypotheses emerge: what exactly can be improved and how it may impact the product.
Example:
The data shows that new users often abandon the ordering process after browsing restaurants. The hypothesis: they don’t trust unfamiliar brands. The solution is to add a “Top Restaurants” filter and badges like “Frequently Ordered.” The goal is to increase trust and improve new-user retention.
Step 5. Test hypotheses and roll out changes
Every hypothesis should be tested. This can be done through A/B testing: show one group of users the new version, another group the old one, and compare behavior. If the metric improves, the change is rolled out. If not, you go back to step 4.
Example:
The team tests a new restaurant card with photos, ratings, and badges. Version B shows an 8% increase in conversion. The A/B test is completed, and the new design is pushed to production. The cycle continues: the next hypothesis is to redesign the order tracking screen because users frequently contact support about it.

How do you make sense of the metrics that really matter? And which tools are best suited for effective mobile app analytics? That’s what the next sections are about.
What to Track in a Mobile App: Key Metrics
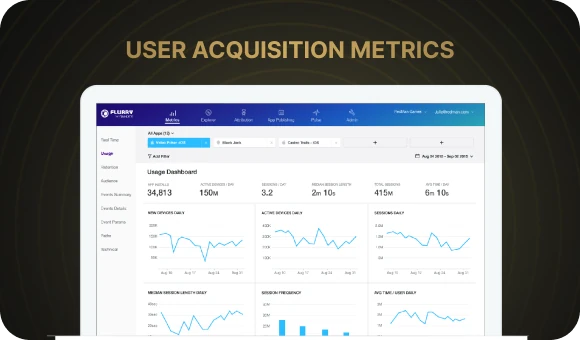
1. Acquisition metrics
These indicators help you understand how users discover the app, where they come from, how much it costs to acquire them, and how interested they are. They help evaluate the effectiveness of marketing channels and identify which sources actually bring in active users.
Installations
The number of times the app has been downloaded and installed. A basic metric used to assess audience growth and advertising performance.
CPI (cost per install)
Shows the average cost of acquiring one new user. If CPI increases, it may signal declining channel efficiency or audience saturation.
Traffic channels
Where users come from: social media, search ads, organic traffic, affiliate programs. What matters is not only the number of installs, but also what users do afterward: some sources bring in higher-quality users than others.
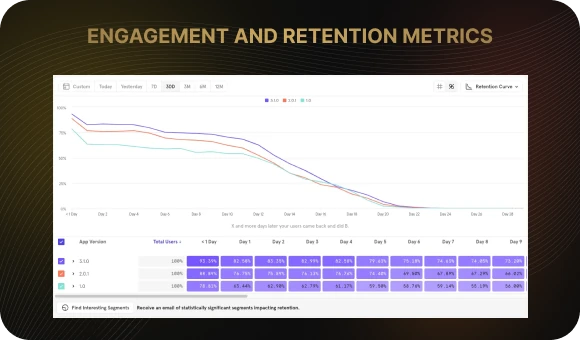
2. Engagement and retention metrics
Getting users to install the app is not enough. What matters much more is whether they come back. This is where mobile app analytics helps reveal the product’s relevance and usefulness in everyday life.
DAU / WAU / MAU
The number of unique users per day, week, and month. These metrics show how actively the app is being used. High numbers are a sign of strong engagement.
Retention Rate
The percentage of users who return after a certain period — for example, one day, three days, or a week after their first session. One of the key indicators of loyalty and user experience quality.
Churn Rate
The percentage of users who stop using the app. This is especially important to monitor after updates and new feature releases in order to spot potential problems early.
Session Length
The average amount of time a user spends in the app per visit. Short sessions may indicate problems with relevance or usability.
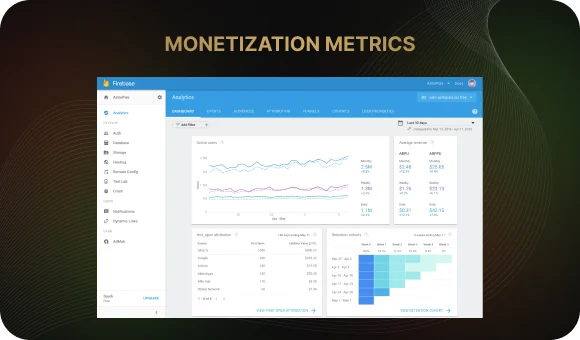
3. Monetization metrics
For an app to grow, it has to generate revenue. Revenue metrics help track how much each user brings in and how stable the income stream is.
ARPU / ARPPU
Average revenue per user (ARPU) and average revenue per paying user (ARPPU). These metrics help assess the effectiveness of the current business model and the potential to increase profit.
LTV (Lifetime Value)
The amount of revenue a user generates over the entire time they use the app. This is a critically important metric, especially when compared with acquisition costs such as CPI.
Conversion Rate
The percentage of users who complete a target action: subscribing, purchasing a product, completing onboarding, and so on. This metric shows how effectively the app moves users toward the desired outcome.
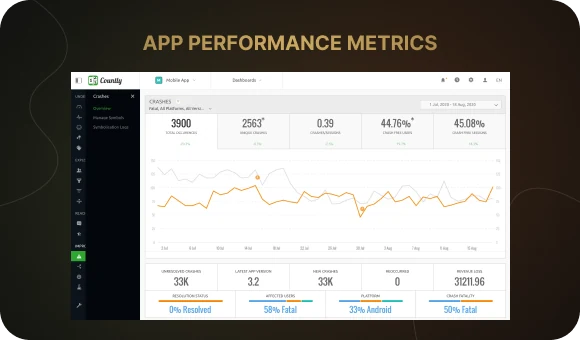
4. Stability and performance metrics
User experience depends directly on how well the app performs. Freezes, crashes, and slow loading times can undo all your efforts in acquisition and retention.
Crash Rate
The number of app crashes per 100 sessions or users. A high error rate is a warning sign for the team. It is especially important to monitor after new releases and on non-standard devices.
App Load Time
The number of seconds between opening the app and seeing the first screen. Even a slight delay can negatively affect retention. Fast launch time is an important part of good UX.
What Analysts Use: Popular Services and Platforms
Below is a selection of common solutions: what mobile app analytics tools exist, how they differ, and when each one is worth using.
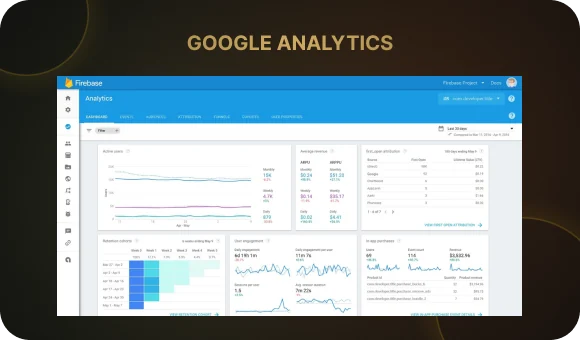
Google Analytics for Firebase
What it can do:
- Collects events automatically and allows you to configure custom events
- Supports audience segmentation by devices, user properties, and events
- The free tier allows tracking up to 500 unique events
- Integrates with other Firebase services: Crashlytics, Remote Config, Cloud Messaging, and A/B testing
- Offers raw data export to BigQuery for deeper analysis
Limitations / what to keep in mind:
- Free plans may become limiting in terms of user or event volume if the app grows quickly
- Some reports are less flexible than those in more advanced product analytics platforms
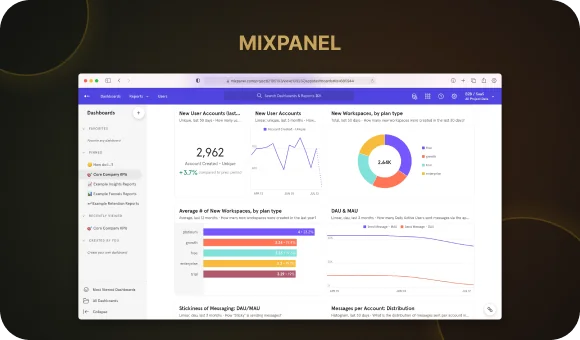
Amplitude and Mixpanel
What they can do:
- Both platforms are focused on product analytics: events, user behavior, cohort analysis, funnels, and retention
- Amplitude is stronger in data management: instrumentation, data cleanliness, and quality control
- Mixpanel is usually easier to use, quicker to get started with, and simpler for building basic reports
- Both support segmentation, user path analysis, funnel visualization, and cohort comparison
Limitations / when to think twice:
- Costs can rise as the number of events and users increases
- To get advanced results, you need solid implementation and confidence in data quality
- Setting up complex cohorts and user paths takes time, resources, and sometimes strong technical support
Choosing the right tool depends on your goals, budget, and the stage your product is at. To avoid wasting time on unnecessary integrations and get the most value out of analytics, it’s worth discussing this with a specialist — they can help you choose the mobile app analytics services that best fit your project.
Conclusion
Analytics helps make a mobile app more precise, user-friendly, and effective. It shows how people interact with the product, where things are working well, and where improvements are needed. It is the foundation for growth, decision-making, and building a truly high-quality user experience. With its help, you can create a clear product logic, reduce unnecessary steps, increase engagement, and make the service more convenient and useful for users.
Want to understand what’s happening in your app?
Stop acting on guesswork. Find out which features truly work, where users are dropping off, and what brings in your most loyal customers. We can help you build analytics in a way that gives you the full picture — from the first touchpoint to repeat purchases.
Ready to make decisions based on data? Fill out the contact form, and our manager will get in touch with you to discuss the details.
What Mobile Analytics Is — in Simple Terms
In-app analytics is the process of collecting and analyzing user actions. Who came to your mobile service, what they tapped, how much time they spent on a screen, what they bought, and where they simply closed the app. All of this data comes together to form a clear picture of how people use the product, where they run into difficulties, what works, and what doesn’t. This makes it possible to evaluate the effectiveness of the user experience and understand which direction to move in next.
To do this, an analyst sets up specialized tools that track key events, actions, and indicators inside the app. The data is then analyzed so decisions are made based on facts rather than guesswork. This approach helps improve the interface, increase engagement, retention, and conversion — and ultimately make the product better for the user.
What Analytics Helps You Do in a Mobile App
Understand your audience.
Who your users are, what devices they use, which traffic sources they come from, and how often they open the app. This is an important first step in speaking their language.
Study user behavior.
What actions people take in the app: what they search for, which screens they spend the most time on, and where they most often exit. Analysts use this data to identify bottlenecks and growth opportunities.
Optimize the product.
Which features are in demand and which go unnoticed. Where users run into friction or don’t understand what to do next. This makes it possible to improve both the interface and the service logic.
Retain users.
Mobile analytics shows why people stop using the app, when it happens, and what can be done to bring them back. For example, by changing onboarding, sending a push notification, or redesigning a flow.
Increase monetization.
How many people make purchases, how much they pay, and how they convert from a free version to a paid one. These metrics help improve in-app sales performance.
Evaluate marketing.
How effective your advertising channels are: which ones actually bring in active users and which ones simply consume budget. Analytics tools make it possible to connect an install with later user behavior.
How to Implement Analytics in a Mobile App: Step by Step
Before talking about tools and metrics, it’s important to understand the logic itself. How does mobile analytics implementation actually work? For clarity, let’s look at an example: a food delivery app. It will show why all of this matters and how it works in practice.
Step 1. Define goals and KPIs
Before connecting tools and collecting data, you need to understand why you’re implementing analytics. What goals matter most for the product right now? What counts as success? It could be increasing order conversion, reducing time to payment, bringing back users who haven’t opened the app in a while, or improving day-7 retention after installation. These goals determine which data you’ll track and how your analytics setup should be built.
Example:
The delivery app team notices that users often fail to reach the final checkout screen. The goal is to increase order conversion by 10%. To achieve this, the analyst defines the key metrics: funnel depth, average time spent at each step, and the number of abandoned carts. These indicators help reveal exactly where users are dropping off.
Step 2. Choose your tools
Next comes platform selection. Everything depends on your goals, budget, and team resources. You can use a single service or build a stack — for example, Firebase for core analytics, AppMetrica for ad tracking, and Amplitude for behavioral analysis.
Example:
The team chooses Google Analytics for Firebase as the foundation — it’s free, quick to implement, and provides basic metrics and event tracking. They also add AppMetrica to see which advertising channels bring in customers and how those users behave afterward. This helps evaluate traffic quality and track the user journey from the very beginning.
Step 3. Set up tracking
The tools need to be implemented correctly. This usually means installing an SDK and setting up events — touchpoints that record actions inside the app: opening a screen, selecting a meal, adding it to the cart, tapping the “Pay” button, canceling an order. These events become the foundation for analysis. At this stage, the analyst works together with the development team: events are added to the code, the necessary parameters are defined, and data transmission is tested.
Example:
Developers add events for every step of the checkout process. The analyst sees that users spend the most time on the payment method step, and some drop off there. The data shows that this is exactly where time and conversion are being lost — a clear sign that the UX of this screen needs improvement.
Step 4. Analyze the data and form hypotheses
Once events start being collected, the most important part begins: analysis. The analyst studies funnels, looks at user behavior, finds bottlenecks, and segments users. This is where hypotheses emerge: what exactly can be improved and how it may impact the product.
Example:
The data shows that new users often abandon the ordering process after browsing restaurants. The hypothesis: they don’t trust unfamiliar brands. The solution is to add a “Top Restaurants” filter and badges like “Frequently Ordered.” The goal is to increase trust and improve new-user retention.
Step 5. Test hypotheses and roll out changes
Every hypothesis should be tested. This can be done through A/B testing: show one group of users the new version, another group the old one, and compare behavior. If the metric improves, the change is rolled out. If not, you go back to step 4.
Example:
The team tests a new restaurant card with photos, ratings, and badges. Version B shows an 8% increase in conversion. The A/B test is completed, and the new design is pushed to production. The cycle continues: the next hypothesis is to redesign the order tracking screen because users frequently contact support about it.
How do you make sense of the metrics that really matter? And which tools are best suited for effective mobile app analytics? That’s what the next sections are about.
What to Track in a Mobile App: Key Metrics
1. Acquisition metrics
These indicators help you understand how users discover the app, where they come from, how much it costs to acquire them, and how interested they are. They help evaluate the effectiveness of marketing channels and identify which sources actually bring in active users.
Installations
The number of times the app has been downloaded and installed. A basic metric used to assess audience growth and advertising performance.
CPI (cost per install)
Shows the average cost of acquiring one new user. If CPI increases, it may signal declining channel efficiency or audience saturation.
Traffic channels
Where users come from: social media, search ads, organic traffic, affiliate programs. What matters is not only the number of installs, but also what users do afterward: some sources bring in higher-quality users than others.
2. Engagement and retention metrics
Getting users to install the app is not enough. What matters much more is whether they come back. This is where mobile app analytics helps reveal the product’s relevance and usefulness in everyday life.
DAU / WAU / MAU
The number of unique users per day, week, and month. These metrics show how actively the app is being used. High numbers are a sign of strong engagement.
Retention Rate
The percentage of users who return after a certain period — for example, one day, three days, or a week after their first session. One of the key indicators of loyalty and user experience quality.
Churn Rate
The percentage of users who stop using the app. This is especially important to monitor after updates and new feature releases in order to spot potential problems early.
Session Length
The average amount of time a user spends in the app per visit. Short sessions may indicate problems with relevance or usability.
3. Monetization metrics
For an app to grow, it has to generate revenue. Revenue metrics help track how much each user brings in and how stable the income stream is.
ARPU / ARPPU
Average revenue per user (ARPU) and average revenue per paying user (ARPPU). These metrics help assess the effectiveness of the current business model and the potential to increase profit.
LTV (Lifetime Value)
The amount of revenue a user generates over the entire time they use the app. This is a critically important metric, especially when compared with acquisition costs such as CPI.
Conversion Rate
The percentage of users who complete a target action: subscribing, purchasing a product, completing onboarding, and so on. This metric shows how effectively the app moves users toward the desired outcome.
4. Stability and performance metrics
User experience depends directly on how well the app performs. Freezes, crashes, and slow loading times can undo all your efforts in acquisition and retention.
Crash Rate
The number of app crashes per 100 sessions or users. A high error rate is a warning sign for the team. It is especially important to monitor after new releases and on non-standard devices.
App Load Time
The number of seconds between opening the app and seeing the first screen. Even a slight delay can negatively affect retention. Fast launch time is an important part of good UX.
What Analysts Use: Popular Services and Platforms
Below is a selection of common solutions: what mobile app analytics tools exist, how they differ, and when each one is worth using.
Google Analytics for Firebase
What it can do:
- Collects events automatically and allows you to configure custom events
- Supports audience segmentation by devices, user properties, and events
- The free tier allows tracking up to 500 unique events
- Integrates with other Firebase services: Crashlytics, Remote Config, Cloud Messaging, and A/B testing
- Offers raw data export to BigQuery for deeper analysis
Limitations / what to keep in mind:
- Free plans may become limiting in terms of user or event volume if the app grows quickly
- Some reports are less flexible than those in more advanced product analytics platforms
Amplitude and Mixpanel
What they can do:
- Both platforms are focused on product analytics: events, user behavior, cohort analysis, funnels, and retention
- Amplitude is stronger in data management: instrumentation, data cleanliness, and quality control
- Mixpanel is usually easier to use, quicker to get started with, and simpler for building basic reports
- Both support segmentation, user path analysis, funnel visualization, and cohort comparison
Limitations / when to think twice:
- Costs can rise as the number of events and users increases
- To get advanced results, you need solid implementation and confidence in data quality
- Setting up complex cohorts and user paths takes time, resources, and sometimes strong technical support
Choosing the right tool depends on your goals, budget, and the stage your product is at. To avoid wasting time on unnecessary integrations and get the most value out of analytics, it’s worth discussing this with a specialist — they can help you choose the mobile app analytics services that best fit your project.
Conclusion
Analytics helps make a mobile app more precise, user-friendly, and effective. It shows how people interact with the product, where things are working well, and where improvements are needed. It is the foundation for growth, decision-making, and building a truly high-quality user experience. With its help, you can create a clear product logic, reduce unnecessary steps, increase engagement, and make the service more convenient and useful for users.
Want to understand what’s happening in your app?
Stop acting on guesswork. Find out which features truly work, where users are dropping off, and what brings in your most loyal customers. We can help you build analytics in a way that gives you the full picture — from the first touchpoint to repeat purchases.
Ready to make decisions based on data? Fill out the contact form, and our manager will get in touch with you to discuss the details.