02.06.2026
Time to read:
7
min
Application Optimization: What It Is and How to Improve Software Performance
Guides
Today, user attention lasts only a few seconds. If an app fails to open or freezes during that time, the user leaves. A delay of just one second can reduce conversion by up to 20%, while frequent crashes can lead to lower ratings and app deletions. Application optimization helps prevent this: it improves speed, increases stability, and reduces support costs. A good place to start is with a simple step — analyze your metrics and fix the most obvious bottlenecks.
In this article, we’ll look at how to improve application performance and which methods actually work for mobile products. You’ll learn which tools are worth using to keep an app running reliably on any device, and why tracking metrics is so important for business growth.


Application Optimization: What It Is and How It Makes a Product Faster and More Cost-Efficient
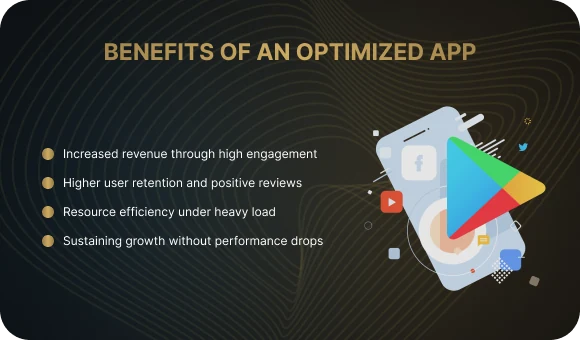
Application optimization is a systematic effort to make a product faster, more stable, and more efficient in its use of resources. It brings together different methods — from improving code and tuning servers to reducing build size and optimizing data handling. The goal is simple: the app should open quickly, run smoothly, and avoid unnecessary maintenance costs.
So what does it mean to optimize an application? It means identifying where the system is losing time and resources, and eliminating those weak points. The team collects metrics such as launch time, response speed, error rates, and memory usage. These data points show exactly where the system is wasting seconds and resources. From there, the process is straightforward: identify the biggest bottlenecks and fix them — reduce unnecessary requests, speed up the database, refactor the code. This approach makes it possible to improve performance based on facts, not guesswork.
How App Speed and Stability Affect Revenue
Faster means more profitable
When a screen loads without delay, users are more likely to complete a purchase or place an order. Research shows that even a one-second delay can reduce conversion by up to 20%. That is why the question of how to speed up an app is directly tied to revenue growth: the less waiting, the higher the engagement and the more repeat actions users take.
Real-world example: an Android e-commerce app was taking up to 4 seconds to open the catalog. The team analyzed the metrics and introduced lazy loading for images. After adding caching and optimizing API requests, the page load time dropped to 1.8 seconds, and conversion increased by 17%.

Stability helps retain users
If an app freezes or crashes, users do not come back. Poor stability lowers app store ratings, and with them the number of installs and overall loyalty. By keeping the crash-free rate above 99.5%, a business preserves user trust and positive reviews.
Real-world example: a fintech app frequently crashed during payments because of a memory leak. The developers used the profiler in Android Studio and found an issue in event handling. After fixing it, crashes dropped by 85%, and the average rating rose from 3.6★ to 4.4★.
Optimization reduces costs
Eliminating redundant requests and unnecessary operations reduces server load and saves resources. Optimized code and well-designed caching make it possible to serve more users with the same infrastructure and budget.
Real-world example: a delivery service used Prometheus to analyze traffic and found dozens of duplicate database requests. After switching to Redis and grouping operations, response time was nearly cut in half, while cloud costs dropped by 40%.
It prepares the product for growth
A scalable app can handle audience growth without losing speed. If the architecture is designed properly, an increase in active users does not lead to performance degradation. This gives the company room to grow without unexpected costs or outages.
Real-world example: a media app experienced traffic spikes during live streams, and the servers stopped responding. The team introduced load balancing and message queues, distributing request flow across multiple servers. After the update, the app remained stable even when usage grew by 250%, with no failures on low-end devices.
Where Application Optimization Happens: The Main Areas
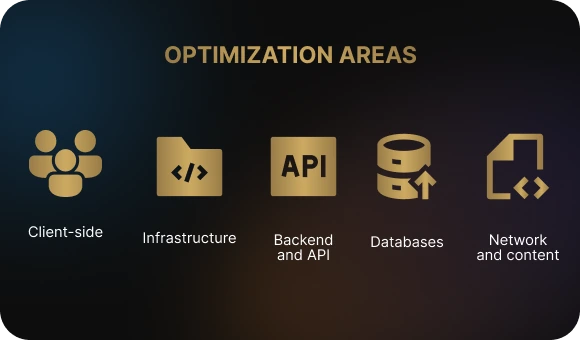
Optimization affects every part of the system — from the interface the user sees to the servers and databases where data is stored. Each of these layers influences speed, stability, and maintenance costs.
Client side
This includes everything that runs directly on the phone or in the browser: startup speed, interface smoothness, and the absence of freezes and crashes. Optimization here includes reducing build size, removing unnecessary libraries, and tuning graphics so the app opens faster and does not overload the device.
Backend and API
Server-side logic is responsible for processing user requests. The lower the response time and the better the caching setup, the faster the app receives data. It is important to eliminate delays, move heavy operations to the background, and keep 5xx errors below 1% of all requests.
Databases
Databases determine how quickly the app can retrieve and store information. Optimization here means adding indexes to speed up searches, fixing slow SQL queries, and using sharding to maintain stable performance as load grows.
Network and content
This includes everything related to delivering data to the user. Using a CDN and compressing images or videos reduces traffic volume and speeds up screen loading. Moving to modern protocols such as HTTP/2 and HTTP/3 allows the browser to process more requests in parallel.
Infrastructure
This is the technical foundation of the app: servers, containers, and load balancers. Autoscaling helps handle traffic spikes without interruptions, while resource monitoring shows where the system is running inefficiently. Properly configured infrastructure supports stable performance and helps control costs.
Quick Wins: What You Can Improve Today
Quick wins are simple steps that deliver noticeable results without requiring a major system rebuild. They help improve speed and stability quickly by reducing response time and server load. Once you understand what application optimization is, it becomes clear that even small changes — combined with the right methods — can significantly improve user experience and lower costs.
Enable caching
Caching stores ready-to-use data and returns it instantly without overloading the server. Set up HTTP caching for the browser, use a CDN for images, and Redis for frequently requested information.
Compress static assets
Use gzip or Brotli for text files, and optimize images and videos. This reduces traffic and speeds up screen loading.
Speed up database queries
Identify the five slowest queries and add indexes where needed. Indexing helps the database find records faster and reduces response time.
Move heavy operations to the background
Image processing, analytics, and email sending should not block the user. Use queues and background jobs to keep the interface responsive.
Reduce app size
Remove unused dependencies, enable code minification, and compress graphics. The smaller the build, the faster the installation and update process — which improves install conversion.
Key Metrics: What to Track and Which Goals to Set
Metrics show exactly where the app is losing speed and stability. Define the indicators that matter, set simple goals, and monitor them on dashboards.
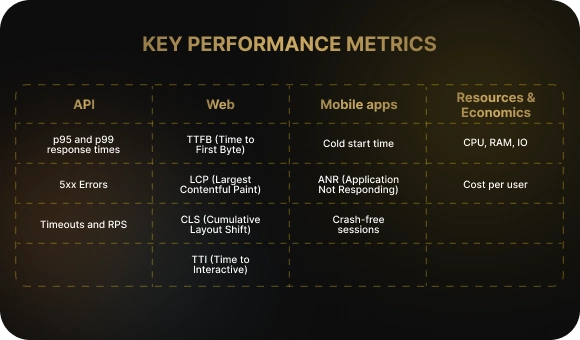
API
- p95 and p99 response time: the time within which 95% and 99% of requests are completed.
Goal: p95 between 200–500 ms for critical endpoints. - 5xx errors: the share of server-side errors out of all requests.
Goal: below 1%. - Timeouts and RPS: monitor timeout rates and throughput to understand how the service behaves under growing load.
Web
- TTFB (Time to First Byte): how quickly the server responds with the first byte.
Goal: as low as possible, with a target of up to 200 ms for key pages. - LCP (Largest Contentful Paint): the time it takes for the main content to appear on the screen.
Goal: up to 2.5 seconds for 75% of users. - CLS (Cumulative Layout Shift): the amount of visual instability on the page.
Goal: up to 0.1. - TTI (Time to Interactive): when the page becomes fully responsive.
Goal: the lower, the better; establish a baseline and improve it iteratively.
Mobile apps
- Cold start time: from launch to the moment the screen is ready.
Goal: up to 2 seconds on modern devices, up to 5 seconds on lower-end ones. - ANR (Application Not Responding): the share of sessions where the interface becomes unresponsive.
Goal: as low as possible; set an alert threshold around 0.1% and react before it gets worse. - Crash-free sessions: the percentage of sessions without crashes.
Goal: above 99.5%, with market leaders aiming for 99.9%.
Resources and economics
- CPU, RAM, IO: processor load, memory consumption, and input/output operations.
Goal: avoid spikes, maintain stable usage, and eliminate memory leaks. - Cost per user: server and network costs per active user.
Goal: reduce$/useras the audience grows through caching, request optimization, and media optimization.
These metrics create the basis for decision-making: they show problem areas, help you set realistic goals, and let you measure the effect of every change.
Tools That Keep Performance Under Control
To make optimization an ongoing process rather than a one-time effort, companies use application performance management systems. These tools help them understand how the product behaves at the code, server, and user levels — and quickly find the causes of slowdowns.
Profilers
Profilers analyze app behavior in real time. Android Studio Profiler and Xcode Instruments show CPU, memory, and graphics load, helping teams find leaks and heavy sections of code.
Monitoring and visualization
Prometheus and Grafana collect and display server performance metrics. For user-facing metrics, tools such as AppMetrica or Google Analytics 4 are useful — they show screen speed, errors, and load time.
Tracing
OpenTelemetry connects logs and requests across services. This makes it possible to see exactly where a request got stuck and how much time each stage took.
APM (Application Performance Monitoring)
Platforms like New Relic, Datadog, and Dynatrace combine profiling, logs, and business metrics. They show how technical issues affect user experience and product performance.
Load testing
Tools like k6 and JMeter simulate hundreds of users working with the system at the same time. This helps teams understand in advance whether the system can handle audience growth without losing speed.
CI/CD and performance testing
Performance should be checked in every build. Tests in the pipeline and automatic alerts show when a new release is slower than the previous one. This allows the team to catch degradation before release and keep quality under control.
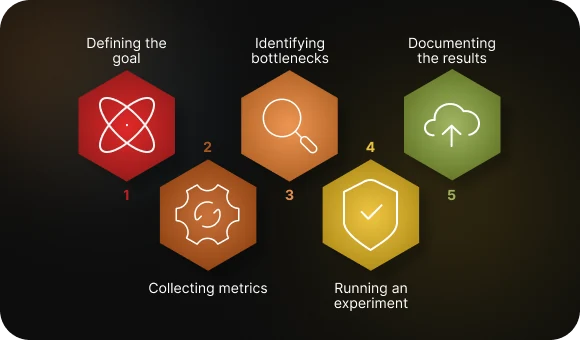
Five Steps to a Faster App: How Optimization Works in Practice
The optimization process can be viewed as a cycle: measure, improve, verify. Each step delivers a tangible result and helps the team move forward without chaos or guesswork.
Step 1. Define the goal
Without a clear goal, it is impossible to define success. For example: reduce launch time to 2 seconds, or lower API p95 response time from 800 ms to 400 ms. Specific numbers help the team stay focused and measure progress.
Step 2. Collect metrics and logs
Before making changes, you need to know the baseline. Measure startup speed, response time, error count, memory usage, and CPU load. These data points become your reference and show where the app is actually slowing down.
Step 3. Find the bottlenecks
Use profilers and monitoring tools to understand what is slowing the system down. It could be a heavy SQL query, an inefficient algorithm, or too many API calls. Build a prioritized list of issues that affect users most.
Step 4. Run an experiment
For each hypothesis, use the cycle: change → verify → compare. Make one improvement, check how the metrics changed, and decide whether to keep it. This reduces the risk of accidental mistakes and makes improvements measurable.
Step 5. Lock in the result
Once the metrics improve, it is important to preserve that result. Automate monitoring with the right tools, add performance tests to CI/CD, and set up alerts. If the numbers start to decline again, the team will know first.
Optimization only works when it becomes part of the development process. It is better to monitor metrics regularly and make targeted improvements than to wait for a crisis and try to fix everything at once.
The Biggest Failures in Optimization: Four Typical Mistakes
No data, no chance
Optimization by guesswork does not work. When a team does not collect performance metrics or run profiling, improvements turn into speculation. Without numbers, it is impossible to understand what really affects speed and stability.
Premature optimization
Teams often try to “speed up” an app before solving architectural problems. That does not make sense: you cannot polish a weak foundation. First, the system needs to work correctly. Only then does it make sense to improve the details.
Trying to improve everything at once
Large-scale changes without prioritization create chaos. When dozens of things are changed simultaneously, it becomes impossible to tell what helped and what broke the product. It is much more effective to move step by step and measure the result of each change.
Ignoring client-side errors
Crashes and freezes directly affect ratings and retention. As long as users keep encountering crashes and unresponsive screens, no backend optimization will deliver meaningful results.
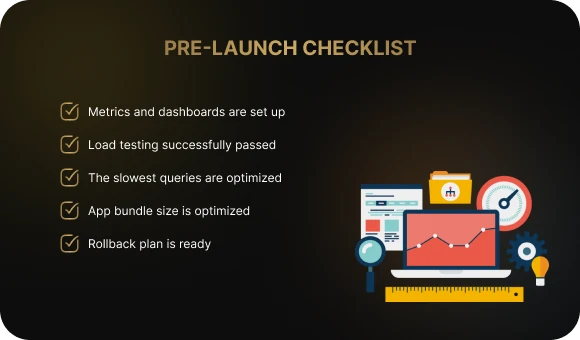
Pre-Release Checklist: Is Everything Ready for Launch?
- Metrics and dashboards are configured. All key indicators — response speed, crashes, and resource usage — are collected automatically. Alerts are active and notify the team about problems.
- Load testing is complete. The app on both Android and iOS can handle the expected number of users without losing speed or stability.
- The slowest requests have been optimized. Bottlenecks in the database and API have been removed, indexes added, and unnecessary calls eliminated.
- The build size has been optimized. The bundle or APK is lighter: unused dependencies have been removed and assets compressed.
- A rollback plan is ready. In case of unexpected issues, the team knows how to restore a stable version quickly and without data loss.
Conclusion
Application optimization is a continuous cycle: measure, improve, verify. It helps a business maintain the level of speed, stability, and efficiency that users can feel from the very first seconds. Start with quick wins and one specific goal for the week. Even small improvements in response time or stability can produce measurable results.
Every second of delay costs sales, and every crash costs customers. Make sure your app is fast and stable before users notice otherwise. The Beetrail team can conduct a technical audit, identify bottlenecks, and propose a clear optimization plan — from simple fixes to strategic performance improvements. Contact us to get a personalized roadmap for improving your product.
Application Optimization: What It Is and How It Makes a Product Faster and More Cost-Efficient
Application optimization is a systematic effort to make a product faster, more stable, and more efficient in its use of resources. It brings together different methods — from improving code and tuning servers to reducing build size and optimizing data handling. The goal is simple: the app should open quickly, run smoothly, and avoid unnecessary maintenance costs.
So what does it mean to optimize an application? It means identifying where the system is losing time and resources, and eliminating those weak points. The team collects metrics such as launch time, response speed, error rates, and memory usage. These data points show exactly where the system is wasting seconds and resources. From there, the process is straightforward: identify the biggest bottlenecks and fix them — reduce unnecessary requests, speed up the database, refactor the code. This approach makes it possible to improve performance based on facts, not guesswork.
How App Speed and Stability Affect Revenue
Faster means more profitable
When a screen loads without delay, users are more likely to complete a purchase or place an order. Research shows that even a one-second delay can reduce conversion by up to 20%. That is why the question of how to speed up an app is directly tied to revenue growth: the less waiting, the higher the engagement and the more repeat actions users take.
Real-world example: an Android e-commerce app was taking up to 4 seconds to open the catalog. The team analyzed the metrics and introduced lazy loading for images. After adding caching and optimizing API requests, the page load time dropped to 1.8 seconds, and conversion increased by 17%.
Stability helps retain users
If an app freezes or crashes, users do not come back. Poor stability lowers app store ratings, and with them the number of installs and overall loyalty. By keeping the crash-free rate above 99.5%, a business preserves user trust and positive reviews.
Real-world example: a fintech app frequently crashed during payments because of a memory leak. The developers used the profiler in Android Studio and found an issue in event handling. After fixing it, crashes dropped by 85%, and the average rating rose from 3.6★ to 4.4★.
Optimization reduces costs
Eliminating redundant requests and unnecessary operations reduces server load and saves resources. Optimized code and well-designed caching make it possible to serve more users with the same infrastructure and budget.
Real-world example: a delivery service used Prometheus to analyze traffic and found dozens of duplicate database requests. After switching to Redis and grouping operations, response time was nearly cut in half, while cloud costs dropped by 40%.
It prepares the product for growth
A scalable app can handle audience growth without losing speed. If the architecture is designed properly, an increase in active users does not lead to performance degradation. This gives the company room to grow without unexpected costs or outages.
Real-world example: a media app experienced traffic spikes during live streams, and the servers stopped responding. The team introduced load balancing and message queues, distributing request flow across multiple servers. After the update, the app remained stable even when usage grew by 250%, with no failures on low-end devices.
Where Application Optimization Happens: The Main Areas
Optimization affects every part of the system — from the interface the user sees to the servers and databases where data is stored. Each of these layers influences speed, stability, and maintenance costs.
Client side
This includes everything that runs directly on the phone or in the browser: startup speed, interface smoothness, and the absence of freezes and crashes. Optimization here includes reducing build size, removing unnecessary libraries, and tuning graphics so the app opens faster and does not overload the device.
Backend and API
Server-side logic is responsible for processing user requests. The lower the response time and the better the caching setup, the faster the app receives data. It is important to eliminate delays, move heavy operations to the background, and keep 5xx errors below 1% of all requests.
Databases
Databases determine how quickly the app can retrieve and store information. Optimization here means adding indexes to speed up searches, fixing slow SQL queries, and using sharding to maintain stable performance as load grows.
Network and content
This includes everything related to delivering data to the user. Using a CDN and compressing images or videos reduces traffic volume and speeds up screen loading. Moving to modern protocols such as HTTP/2 and HTTP/3 allows the browser to process more requests in parallel.
Infrastructure
This is the technical foundation of the app: servers, containers, and load balancers. Autoscaling helps handle traffic spikes without interruptions, while resource monitoring shows where the system is running inefficiently. Properly configured infrastructure supports stable performance and helps control costs.
Quick Wins: What You Can Improve Today
Quick wins are simple steps that deliver noticeable results without requiring a major system rebuild. They help improve speed and stability quickly by reducing response time and server load. Once you understand what application optimization is, it becomes clear that even small changes — combined with the right methods — can significantly improve user experience and lower costs.
Enable caching
Caching stores ready-to-use data and returns it instantly without overloading the server. Set up HTTP caching for the browser, use a CDN for images, and Redis for frequently requested information.
Compress static assets
Use gzip or Brotli for text files, and optimize images and videos. This reduces traffic and speeds up screen loading.
Speed up database queries
Identify the five slowest queries and add indexes where needed. Indexing helps the database find records faster and reduces response time.
Move heavy operations to the background
Image processing, analytics, and email sending should not block the user. Use queues and background jobs to keep the interface responsive.
Reduce app size
Remove unused dependencies, enable code minification, and compress graphics. The smaller the build, the faster the installation and update process — which improves install conversion.
Key Metrics: What to Track and Which Goals to Set
Metrics show exactly where the app is losing speed and stability. Define the indicators that matter, set simple goals, and monitor them on dashboards.
API
- p95 and p99 response time: the time within which 95% and 99% of requests are completed.
Goal: p95 between 200–500 ms for critical endpoints. - 5xx errors: the share of server-side errors out of all requests.
Goal: below 1%. - Timeouts and RPS: monitor timeout rates and throughput to understand how the service behaves under growing load.
Web
- TTFB (Time to First Byte): how quickly the server responds with the first byte.
Goal: as low as possible, with a target of up to 200 ms for key pages. - LCP (Largest Contentful Paint): the time it takes for the main content to appear on the screen.
Goal: up to 2.5 seconds for 75% of users. - CLS (Cumulative Layout Shift): the amount of visual instability on the page.
Goal: up to 0.1. - TTI (Time to Interactive): when the page becomes fully responsive.
Goal: the lower, the better; establish a baseline and improve it iteratively.
Mobile apps
- Cold start time: from launch to the moment the screen is ready.
Goal: up to 2 seconds on modern devices, up to 5 seconds on lower-end ones. - ANR (Application Not Responding): the share of sessions where the interface becomes unresponsive.
Goal: as low as possible; set an alert threshold around 0.1% and react before it gets worse. - Crash-free sessions: the percentage of sessions without crashes.
Goal: above 99.5%, with market leaders aiming for 99.9%.
Resources and economics
- CPU, RAM, IO: processor load, memory consumption, and input/output operations.
Goal: avoid spikes, maintain stable usage, and eliminate memory leaks. - Cost per user: server and network costs per active user.
Goal: reduce$/useras the audience grows through caching, request optimization, and media optimization.
These metrics create the basis for decision-making: they show problem areas, help you set realistic goals, and let you measure the effect of every change.
Tools That Keep Performance Under Control
To make optimization an ongoing process rather than a one-time effort, companies use application performance management systems. These tools help them understand how the product behaves at the code, server, and user levels — and quickly find the causes of slowdowns.
Profilers
Profilers analyze app behavior in real time. Android Studio Profiler and Xcode Instruments show CPU, memory, and graphics load, helping teams find leaks and heavy sections of code.
Monitoring and visualization
Prometheus and Grafana collect and display server performance metrics. For user-facing metrics, tools such as AppMetrica or Google Analytics 4 are useful — they show screen speed, errors, and load time.
Tracing
OpenTelemetry connects logs and requests across services. This makes it possible to see exactly where a request got stuck and how much time each stage took.
APM (Application Performance Monitoring)
Platforms like New Relic, Datadog, and Dynatrace combine profiling, logs, and business metrics. They show how technical issues affect user experience and product performance.
Load testing
Tools like k6 and JMeter simulate hundreds of users working with the system at the same time. This helps teams understand in advance whether the system can handle audience growth without losing speed.
CI/CD and performance testing
Performance should be checked in every build. Tests in the pipeline and automatic alerts show when a new release is slower than the previous one. This allows the team to catch degradation before release and keep quality under control.
Five Steps to a Faster App: How Optimization Works in Practice
The optimization process can be viewed as a cycle: measure, improve, verify. Each step delivers a tangible result and helps the team move forward without chaos or guesswork.
Step 1. Define the goal
Without a clear goal, it is impossible to define success. For example: reduce launch time to 2 seconds, or lower API p95 response time from 800 ms to 400 ms. Specific numbers help the team stay focused and measure progress.
Step 2. Collect metrics and logs
Before making changes, you need to know the baseline. Measure startup speed, response time, error count, memory usage, and CPU load. These data points become your reference and show where the app is actually slowing down.
Step 3. Find the bottlenecks
Use profilers and monitoring tools to understand what is slowing the system down. It could be a heavy SQL query, an inefficient algorithm, or too many API calls. Build a prioritized list of issues that affect users most.
Step 4. Run an experiment
For each hypothesis, use the cycle: change → verify → compare. Make one improvement, check how the metrics changed, and decide whether to keep it. This reduces the risk of accidental mistakes and makes improvements measurable.
Step 5. Lock in the result
Once the metrics improve, it is important to preserve that result. Automate monitoring with the right tools, add performance tests to CI/CD, and set up alerts. If the numbers start to decline again, the team will know first.
Optimization only works when it becomes part of the development process. It is better to monitor metrics regularly and make targeted improvements than to wait for a crisis and try to fix everything at once.
The Biggest Failures in Optimization: Four Typical Mistakes
No data, no chance
Optimization by guesswork does not work. When a team does not collect performance metrics or run profiling, improvements turn into speculation. Without numbers, it is impossible to understand what really affects speed and stability.
Premature optimization
Teams often try to “speed up” an app before solving architectural problems. That does not make sense: you cannot polish a weak foundation. First, the system needs to work correctly. Only then does it make sense to improve the details.
Trying to improve everything at once
Large-scale changes without prioritization create chaos. When dozens of things are changed simultaneously, it becomes impossible to tell what helped and what broke the product. It is much more effective to move step by step and measure the result of each change.
Ignoring client-side errors
Crashes and freezes directly affect ratings and retention. As long as users keep encountering crashes and unresponsive screens, no backend optimization will deliver meaningful results.
Pre-Release Checklist: Is Everything Ready for Launch?
- Metrics and dashboards are configured. All key indicators — response speed, crashes, and resource usage — are collected automatically. Alerts are active and notify the team about problems.
- Load testing is complete. The app on both Android and iOS can handle the expected number of users without losing speed or stability.
- The slowest requests have been optimized. Bottlenecks in the database and API have been removed, indexes added, and unnecessary calls eliminated.
- The build size has been optimized. The bundle or APK is lighter: unused dependencies have been removed and assets compressed.
- A rollback plan is ready. In case of unexpected issues, the team knows how to restore a stable version quickly and without data loss.
Conclusion
Application optimization is a continuous cycle: measure, improve, verify. It helps a business maintain the level of speed, stability, and efficiency that users can feel from the very first seconds. Start with quick wins and one specific goal for the week. Even small improvements in response time or stability can produce measurable results.
Every second of delay costs sales, and every crash costs customers. Make sure your app is fast and stable before users notice otherwise. The Beetrail team can conduct a technical audit, identify bottlenecks, and propose a clear optimization plan — from simple fixes to strategic performance improvements. Contact us to get a personalized roadmap for improving your product.