Application optimization — what it is and how to speed up the program
App optimization — what is it and how to speed up the program
Today, the user's attention lasts only a few seconds. If the application does not open or freezes during this time, the person leaves. A delay of just a second can reduce conversions by up to 20%, and frequent crashes result in a drop in rankings and an app being removed. App optimization helps avoid this: it speeds up performance, improves stability, and reduces support costs. You can start with something simple: analyze metrics and eliminate the most obvious bottlenecks.
In this article, we'll look at how to improve app performance and what methods really work for mobile products. You'll learn what tools to use to make the app work consistently on any device, and why monitoring metrics is so important for business growth.


App optimization — what it is and how it makes the product faster and cheaper
App optimization — what it is and how it makes the product faster and cheaper
Application optimization is a systematic effort that makes the product faster, more stable and more economical in using resources. It combines different methods, from improving code and configuring servers to reducing build size and optimizing data processing. There is only one goal: for the application to open instantly, not to freeze and not spend extra money on maintenance.
What does it mean to optimize an app? Understand where the system is losing time and resources and address these weaknesses. The team collects metrics: launch time, response speed, error rate, and memory consumption. This data shows where the system is losing seconds and resources. Then everything is simple: identify the most bottlenecks and eliminate them — reduce unnecessary requests, speed up the database, and rework the code. This approach allows you to improve performance not at random, but on the basis of facts.
How app speed and stability affect revenue
How app speed and stability affect revenue
Faster means more profitable
When the screen loads without waiting, users are more likely to make a purchase or order. Research shows that a delay of just a second can reduce conversions by 20%. Therefore, the question of how to speed up an app is directly related to revenue growth: the lower the expectations, the higher the engagement and reactivity.
- Case study: The e-commerce app on Android took up to 4 seconds to open the catalog. The team analyzed the metrics and used the method of lazily uploading images. After implementing the cache and optimizing API requests, the page opened in 1.8 seconds, and the conversion rate increased by 17%.

Stability keeps the audience
If the app freezes or crashes, users don't come back. When stability is low, store ratings fall, and so does the number of installs and loyalty. By maintaining a crash-free level above 99.5%, the business maintains trust and positive reviews.
- Case study: The fintech app often “crashed” when paying due to a memory leak. Developers started using the profiler in Android Studio and found a bug in event processing. After the correction, the number of departures fell by 85%, and the average rating rose from 3.6 ★ to 4.4 ★.
Optimization reduces costs
Eliminating redundant requests and redundant operations reduces server load and saves resources. Optimized code and smart caching allow us to serve more users with the same capacity and budget.
- Case study: the delivery service used the Prometheus tool to analyze traffic and found dozens of duplicate database requests. After moving to Redis and grouping operations, response times were almost halved, and cloud costs were reduced by 40%.
Willingness to grow
A scalable application can withstand audience growth without losing speed. If the architecture is built correctly, an increase in the number of active users does not lead to performance degradation. This allows the company to grow without unexpected costs and disruptions.
- Case study: The media app encountered traffic spikes during live broadcasts, and the servers stopped responding. The team started using load balancing and message queuing, distributing the flow of requests between servers. After the update was implemented, the application worked steadily even with a 250% increase in usage and without failures on weak devices.

Where the application is optimized: main areas
Where the application is optimized: main areas
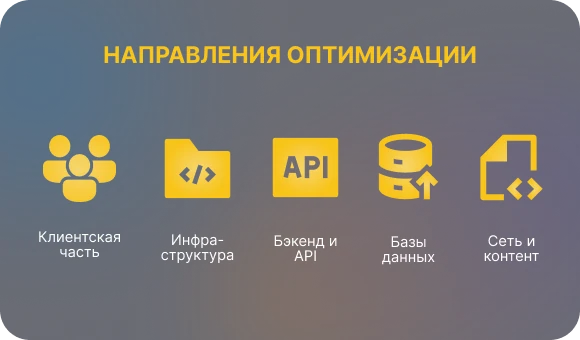
Optimization covers all parts of the system — from the interface that the user sees to the servers and databases where data is stored. Each of them affects the speed, stability and cost of service.
The client side. This is everything that works right on your phone or in a browser: launch speed, smooth interface, no freezes and crashes. Here, optimization includes reducing the build size, removing unnecessary libraries, and adjusting the graphics so that the application opens faster and does not overload the device.
Backend and API. Server logic is responsible for processing user requests. The shorter the response time and the better caching is configured, the faster the application receives data. It is important to remove delays, put heavy operations in the background, and make sure that 5xx errors do not exceed 1% of all requests.
Databases. They determine how fast an app receives and stores information. Here, optimization means indexes that speed up searching, correcting slow SQL queries, and using sharding (data sharing between servers) for stable operation when the load increases.
Web and content. This includes everything related to the transfer of data to the user. Using CDNs (content delivery networks) and compressing images or videos reduce traffic and make screens load faster. The transition to modern HTTP/2 and HTTP/3 protocols allows the browser to process more requests simultaneously.
Infrastructure. This is the technical “basis” of the application: servers, containers, and balancers. Autoscaling helps to withstand load peaks without interruptions, and resource monitoring shows where the system is inefficient. A properly configured infrastructure maintains stable performance and saves the budget.
Quick wins: what can be improved today
Quick wins: what can be improved today
Quick wins, or quick wins, are simple steps that give noticeable results without complicated system adjustments. They allow you to quickly increase the speed and stability of work, reducing response time and server load. When you understand app optimization, it's obvious that even small changes and the right methods can significantly improve the user experience and reduce costs.
- Enable caching. The cache stores ready-made data and sends it instantly without overloading the server. Set up an HTTP cache for your browser, a CDN for images, and Redis for frequently requested information.
- Compress static resources. Use gzip or Brotli for text files, optimize images and videos. This will reduce traffic and speed up screen loading.
- Speed up database queries. Find the five slowest queries and add indexes to them. Indexing helps the database quickly find the records it needs and reduces response time.
- Bring heavy surgeries into the background. Image processing, analytics, or sending emails should not block a user. Use queues and background tasks to keep the interface responsive.
- Reduce the size of the app. Remove unused dependencies, enable code minification and graphics compression. The smaller the build size, the faster the installation and updates, which means the higher the conversion rate to installations.
Key metrics: what to watch and what goals to set
Key metrics: what to watch and what goals to set
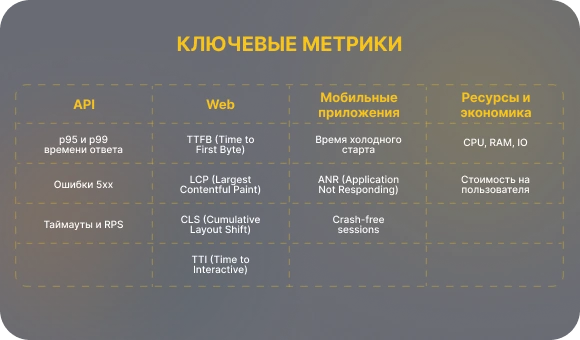
The metrics show exactly where the app is losing speed and stability. Identify important metrics, set simple goals, and track them on dashboards.
APIS
- p95 and p99 response times: the time that 95% and 99% of requests meet. Target: p95 200—500 ms at critical endpoints.
- 5xx errors: the proportion of server errors from all requests. Target: less than 1%.
- Timeouts and RPS: Keep track of timeouts and bandwidth to see how the service behaves under increased load.
Web
- TTFB (Time to First Byte): server response speed up to the first byte. The goal: as low as possible, a target of up to 200 ms on the main pages.
- LCP (Largest Contentful Paint): when the main content appears on the screen. Target: Up to 2.5 seconds for 75% of users.
- CLS (Cumulative Layout Shift): “twitching” interface elements. Target: up to 0.1.
- TTI (Time to Interactive): When the page becomes fully responsive. Goal: less is more; capture the baseline and iterate to improve it.
Mobile apps
- Cold start time: from start to screen ready. Target: up to 2 seconds on modern devices, up to 5 seconds on weak devices.
- ANR (Application Not Responding): The proportion of sessions where the interface is “unresponsive”. Goal: Keep the alarm threshold as low as possible around 0.1% and react early.
- Crash-free sessions: percentage of sessions without crashes. Target: above 99.5%, market leaders have 99.9%.
Resources and economy
- CPU, RAM, IO: processor load, memory consumption, I/O operations. The goal: to avoid peaks, keep stable values, and eliminate memory leaks.
- Cost per user: server and network costs per active user. The goal: to reduce $/user as the audience grows due to the cache, optimization of queries and media.
These metrics provide a basis for solutions: you see problem areas, set realistic goals, and check the effect of each change.
Tools that keep productivity under control
Tools that keep productivity under control
To ensure that optimization is not a one-time campaign, but an ongoing process, companies use application performance management systems. They help you see how the product works at the code, server, and user levels, and quickly find the reasons for slowdowns.
Profilers
They analyze the application's behavior in real time. Android Studio Profiler and Xcode Instruments show the load on the processor, memory and graphics, and help you find leaks and “heavy” pieces of code.
Monitoring and visualization
Prometheus and Grafana collect and display server performance metrics. For user metrics, AppMetrica or Google Analytics 4 are suitable — they show screen speed, errors, and load times.
Tracing (tracking requests)
OpenTelemetry connects logs and requests between services. This allows you to understand exactly where the request was “stuck” and how long each step took.
APM (Application Performance Monitoring)
Platforms like New Relic, Datadog, or Dynatrace combine profiling, logs, and business metrics. They show how technical issues affect user experience and product metrics.
Load testing
The k6 and JMeter tools simulate the work of hundreds of users simultaneously. This helps to understand in advance whether the system will withstand audience growth without losing speed.
CI/CD and performance tests
Performance should be checked in every build. Pipeline tests and automatic alerts show if the new release has become slower. This is how the team notices degradation before the release and keeps the quality under control.

5 steps to speed up an application: how optimization works in practice
5 steps to speed up an application: how optimization works in practice
The optimization process can be thought of as a cycle: measure, improve, test. Each step gives a specific result and helps you move without chaos and guesswork.
Step 1. Define a goal
Without a clear goal, it's impossible to understand what counts as success. For example: reduce the startup time to 2 seconds, or reduce the API response time p95 from 800 to 400 ms. Specific numbers help the team focus and measure progress.
Step 2. Collect metrics and logs
Before making changes, you need to know the initial state. Measure startup speed, response time, error rate, memory usage, and processor usage. This data will become a starting point and will show where the application really “slows down”.
Step 3. Find bottlenecks
Use profilers and monitoring to understand what's slowing down the system. This could be a heavy SQL query, an inefficient algorithm, or too frequent API calls. Make a list of priority issues that affect the user.
Step 4. Do an experiment
For each hypothesis, use the change-test-comparison cycle. Make one improvement, see how metrics have changed, and decide whether to keep it or not. This approach reduces the risk of accidental errors and makes improvements measurable.
Step 5. Record the result
When metrics have improved, it's important to maintain the effect. Automate monitoring with the right tools, add performance tests to CI/CD, and set up alerts. If the numbers start to fall again, the team will be the first to know.
Optimization only works when it becomes part of the development process. It is better to regularly check metrics and make targeted improvements than to wait for a crisis and then fix everything at once.

Major optimization failures: 4 common mistakes
Major optimization failures: 4 common mistakes
- No data, no chance. Optimization doesn't work at random. When a team doesn't collect performance metrics or do profiling, improvements turn into guessing. Without numbers, it's impossible to understand what really affects speed and stability.
- Premature optimization. They often try to “speed up” an application before architectural problems are resolved. This is pointless: a weak base cannot be polished. First, you need to make sure that the system works correctly, and only then improve the details.
- Trying to improve everything at once. Massive change without priority creates chaos. When dozens of things are being fixed at once, it's impossible to understand what helped and what broke the product. It is more efficient to move step by step, measuring everyone's result.
- Ignoring errors on the client. Crashes and freezes directly affect ratings and retention. While users face crashes and freezes, no backend optimization will work.
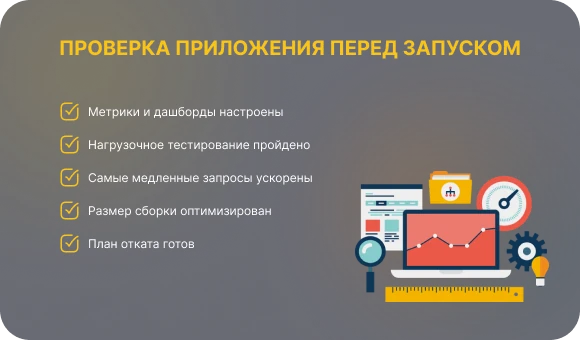
Pre-release checklist: is everything ready for launch
✓ Metrics and dashboards are configured. All key metrics — response speed, crashes, resource utilization — are collected automatically. Alerts are working and notifying the team about problems.
✓ Load testing has been completed. The application on both Android and iOS can withstand the expected number of users without a drop in speed and stability.
✓ The slowest requests are speeded up. Database and API bottlenecks have been removed, indexes have been added, and unnecessary calls have been removed.
✓ The build size is optimized. The bundle or APK has become lighter: unused dependencies have been removed and resources have been compressed.
✓ The rollback plan is ready. In case of unforeseen problems, there is a rollback plan: the team knows how to quickly return the stable version without losing data.
App optimization is a continuous cycle: measure, improve, and test. It helps businesses keep speed, stability and efficiency at the level that users feel from the first seconds. Start with quick wins and one specific goal for the week. Even small improvements in response speed or stability have a measurable effect.
Every second of delay is worth sales, and every drop costs customers. Make sure your app is fast and stable before users notice otherwise. The Beetrail team will conduct a technical audit, identify bottlenecks and offer a clear optimization plan, from simple adjustments to strategic performance improvements. Contact us for a personalized roadmap of improvements for your product.