Mobile app analytics
Mobile app analytics
Try to remember what our lives looked like ten years ago. There were few applications, and most services existed in a browser: marketplaces were used through the site, but deliveries through apps were not particularly trusted — orders were often placed directly on the restaurant's website. Recommendations and algorithms were just taking shape, and there was almost no personalization. Most of the day-to-day transactions, from payments to paperwork, took place offline. Even if the company had an app, it often acted as an “add-on” — businesses did not consider the mobile format as the main tool for working with customers.
Since then, the world has changed: mobile services have not just become mainstream, they have become much more complex and technologically advanced. The interfaces are thought out to the smallest detail, algorithms adapt to us, and services become “smart” and quietly take on dozens of tasks. The mobile app market grew to $540 billion in 2024, and is expected to reach $585 billion in 2025. People are spending more and more time on mobile services, which means that competition for attention and convenience is growing.
Have you ever wondered how top apps achieved their level and efficiency? How did they become so convenient and accurate? How did it happen that people come back to them every day, spend time there, place orders, subscribe? How is it possible to build such a user experience blindly—just by intuition or inspiration? Certainly not.
Mobile app analytics is behind every user-friendly screen. It is not limited to calculating the number of downloads and showing basic metrics. It keeps track of what's going on inside: where the user gets stuck, at what point they close the app, at what step they have a question. And vice versa — what catches you, where it involves you when he starts acting. Without this, it is impossible to understand how the product works and where to develop it.


What is mobile analytics in simple words
What is mobile analytics in simple words
In-app analytics is the collection and analysis of user actions. Who came to the mobile service, where they clicked, how much time they spent on the screen, what they bought, and where they just closed them. All this data forms a clear picture: how people use the product, where difficulties arise, what works and what doesn't. This allows you to evaluate the effectiveness of the user experience and understand which way to move forward.
To do this, the analyst sets up special tools — they track key events, actions, and metrics within the application. All this is then analyzed so that decisions are made not at random, but based on facts. This approach helps improve the interface, increase engagement, retention, and conversion, which means making the product better for the user.
What exactly does analytics help you do in a mobile app:
- Understand the audience. Who are your users, what devices and traffic sources they come from, how often they open the app. This is an important step to speak the same language with them.
- Study behavior. What people do in the app: what they're looking for, what screens they spend the most time on, where they most often go out. The analyst uses this data to find bottlenecks and growth points.
- Optimize the product. Which features are in demand and which ones go unnoticed. Where the user faces inconveniences or does not understand how to act. This allows us to improve the interface and logic of the service.
- Retain users. Mobile analytics shows why people stop using the app when it happens and what you can do to get them back. For example, change the onboarding, push, or rebuild the script.
- Increase monetization. How many people buy, how much they pay, how they convert from the free version to the paid version. These metrics help improve in-app sales performance.
- Evaluate marketing. How effective are advertising channels: which ones actually attract active users, and where are the budgets spent? Analytics tools allow you to link the installation to further behavior.

How to integrate analytics into a mobile app: step by step
How to integrate analytics into a mobile app: step by step
Before talking about tools and metrics, it's important to understand the logic itself. How is mobile analytics even being implemented? For clarity, let's look at an example — a mobile food delivery application. It will show why all this is needed and how it works in reality.
Step 1. We define goals and indicators
Before you connect tools and collect data, it's important to understand why you're implementing analytics. What tasks are important for the product right now? What counts as success? This could be an increase in order conversions, a decrease in the time to payment, the return of users who haven't visited for a long time, or, for example, an increase in retention on the seventh day after installation. These goals will determine what data you will monitor and how you will build analytics.
- Example:
In the delivery app, the team notices that people often don't make it to the final design screen. The goal is to increase conversion to order by 10%. To achieve this, the analyst formulates metrics: funnel depth, average time at each step, and the number of abandoned baskets. These metrics will help you understand exactly where users drop out.
Step 2. We choose tools
Next is the choice of platforms. It all depends on the team's tasks, budget, and resources. You can use one service, or you can build a stack: for example, Firebase for basic analytics, AppMetrica for ad tracking, and Amplitude for behavioral analytics.
- Example:
The team chooses Google Analytics for Firebase as a base—it's free, quick to connect, and provides basic metrics and events. In addition, they connect AppMetrica to see what advertising channels customers come from and how they behave next. This helps you measure traffic performance and track the user journey right from the start.

Step 3. Setting up tracking
The tools must be implemented correctly. This is usually installing the SDK and setting up events — points that will record actions within the application: opening the screen, choosing a dish, adding to the cart, clicking the “Pay” button, canceling the order. These events become the basis for analysis. At this stage, the analyst works together with the development team: events are added to the code, the necessary parameters are specified, and data transfer is tested.
- Example:
Developers add events to every step of the checkout process. The analyst sees that users spend the longest time choosing a payment method, and some of them leave. The data shows that this is where time is wasted and the conversion is a hint that the UX of this screen needs to be improved.
Step 4. We analyze data and form hypotheses
When events are collected, the most important part begins: analysis. The analyst studies funnels, looks at user behavior, finds bottlenecks, and highlights segments. At this stage, hypotheses arise: what exactly can be improved and how this will affect the product.
- Example:
Data shows that newcomers often drop an order after browsing restaurants. Hypothesis: They don't trust unfamiliar brands. The solution is to add the “Top Restaurants” filter and the “Frequently ordered” badges. The goal is to increase trust and retain new users.
Step 5. We test hypotheses and implement changes
It is important to test any hypothesis. This can be done through A/B testing: show one part of the customers the new version, the other part of the client the old version, and compare the behavior. If the metric improves, the solution is implemented. If not, go back to step 4.
- Example:
The team is testing a new restaurant card with photos, ratings and badges. Option B shows an 8% increase in conversions. The A/B test is over, and the new design goes into production. The cycle continues: the next hypothesis is to redesign the order tracking screen, because it is often used by support staff.

How do you understand the metrics that are important to monitor? And what tools are suitable for effective use of analytics in a mobile app? This is discussed in the following sections.
What to track in the mobile app: key metrics
What to track in the mobile app: key metrics
1. Engagement metrics
These metrics help you understand how users learn about the app, where they come from, how much it costs to acquire them, and how interested they are. They help evaluate the effectiveness of marketing channels and identify which sources actually bring active users.
- Installations
How many times the app has been downloaded and installed. A basic indicator required for assessing audience growth and the effectiveness of advertising campaigns.
- CPI (cost per installation)
Shows how much it costs on average to attract one new user. If the CPI increases, this may signal a drop in channel performance or an exhaustion of audiences.
- Traffic channels
Where customers come from: social media, search ads, organic traffic, affiliate programs. It's not just the number of installs that matters, but also the subsequent behavior: some sources bring in more “high-quality” users than others.

2. Activity and retention metrics
Simply installing the app is not enough. It is much more important that the user comes back to it again. Here, mobile app analytics allows you to see the level of interest and usefulness of a product in everyday life.
- DAU/ WAU/ MAU
The number of unique users per day, week, and month. These metrics show how actively an app is being used. High performance is a sign of good engagement.
- Retention Rate
What percentage of users come back after a certain amount of time — for example, a day, three, or a week after the first session. One of the key indicators of loyalty and the quality of user experience.
- Churn Rate (churn rate)
How many users stop using the app. It is especially important to monitor this after updates and the introduction of new features in order to notice possible problems in time.
- Session Length
The average amount of time a user spends on the app per visit. Short sessions may indicate problems with interest or convenience. \

3. Monetization metrics
For an app to develop, it must be profitable. Revenue metrics allow you to track how much each user brings in and how stable the revenue stream is.
- ARPU/ARPPU
Average revenue per user (ARPU) and separately per paying user (ARPPU). These indicators help assess the effectiveness of the current business model and the potential for increasing profits.
- LTV (Lifetime Value)
How much revenue a user generates for the entire time they use the app. This is a critical metric, especially when compared to acquisition costs (CPI).
- Conversion Rate (conversion)
The percentage of users who perform a targeted action: subscribe, buy a product, complete onboarding, etc. This metric shows how effectively the application leads the user to the desired result.
4. Stability and performance metrics
The user experience directly depends on how well the app works. Freezes, crashes, and lengthy loading times can undermine all attraction and retention efforts.
- Crash Rate (crash rate)
The number of app crashes per 100 sessions or users. A high error rate is a wake-up call for the team. It is especially important to monitor after new releases and on non-standard devices.
- App Load Time
How many seconds do it take from opening the app to the first screen appearing. Even a small delay can have a negative impact on retention. A quick start is an important element of good UX.

What do analysts use: popular services and platforms
What do analysts use: popular services and platforms
Below is a selection of popular solutions: what mobile app analytics tools exist, how they differ, and when to use each of them.
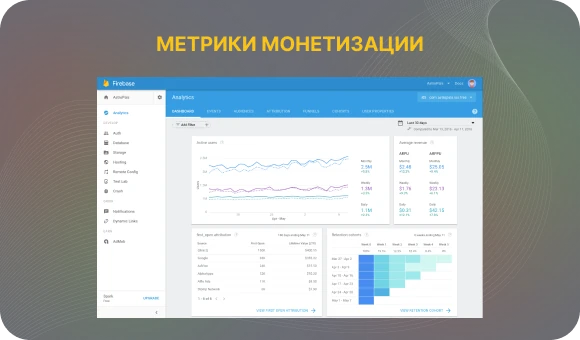
Google Analytics for Firebase
What it can do:
- Collects events automatically+ allows you to customize your own events.
- It supports audience segmentation: by device, by user properties, by events.
- The free plan allows you to track up to 500 unique events.
- Integration with other Firebase services: Crashlytics (crashes), Remote Config, Cloud Messaging, A/B testing.
- The ability to export raw data to BigQuery for deeper analysis.
Limitations/things to consider:
- Free plans may be limited in terms of users or events if the app is growing rapidly.
- Some reports are not as flexible as those of advanced product analytics platforms.

Amplitude and Mixpanel
What they can do:
- Both platforms are focused on product analysis: events, user behavior, cohort analysis, funnels, retention.
- Amplitude is strong in data management (data instrumentation, data purity, quality control).
- Mixpanel is usually easier to interface, a little faster to start, and easier to show basic reports.
- Both support segmentation, user path analysis, funnel visualization, and cohort comparison.
Limitations/when to think twice:
- With a large number of events and users, the cost may increase.
- To get advanced results, you need a good implementation (a tool + trust in the quality of the data collected).
- Setting up complex cohorts and paths takes time, resources, and sometimes a strong technical part.

AppMetrica (Yandex)
What it can do:
- Universal tool: product analytics+marketing analytics+crash reports.
- It compiles reports on user retention, segmentation, traffic sources, and funnels.
- Support for A/B tests, push notifications, data export and API.
- It works on Android and iOS, and has an SDK for different platforms, including cross-platform frameworks. It is suitable for detailed analysis of Android applications, especially in combination with advertising attribution and bug tracking.
Limitations/features:
- Free access is limited: a large number of events or users may require a paid plan.
- Some users note that the interface and navigation are more complicated than in simpler analogues.

Choosing the right tool depends on the tasks, budget, and the stage at which the product is located. In order not to waste time on unnecessary integrations and get the most out of using analytics, you should discuss this with a specialist — he will help you choose the mobile app analytics services that are right for your project.
Conclusion
Analytics help make a mobile app more accurate, more convenient, and more powerful. It shows how people interact with the product, where things work well, and where things can be improved. This is the basis for growth, decision-making and building a truly high-quality user experience. It can be used to build clear logic, reduce unnecessary steps, increase engagement and make the service convenient and useful for people.
Do you want to understand what's going on in your app?
Stop acting at random. Learn what features really work, where users leave, and what brings their most loyal customers. We'll help you build analytics so you can see the whole picture, from the first touch to repeat purchases. Ready to make decisions based on data? Fill out the feedback form and our manager will contact you to discuss the details.